In his hit song "War," Motown singer Edwin Starr asked a poignant question: "War, huh, yeah, what is it good for?" Well, from a purple teamer’s perspective, the same can be asked of Performance Monitor (PerfMon), and the answer will be the same—"ABSOLUTELY NOTHING!”
That’s exactly what I thought when I first began looking into “alternate” means of Kerberos telemetry (i.e., beyond the standard/norm of Windows Events 4768/4769) when Charlie Clark and I released our tool WonkaVision during our talk “I’ve Got a Golden Twinkle in My Eye” at SANS PenTest HackFest 2022.
During our initial Golden Ticket attack and detection research, I recalled reading the 2018 Microsoft post by Mark Morowczynski, "Domain and DC Migrations: How to Monitor LDAP, Kerberos, and NTLM Traffic to Your Domain." At the time, I didn’t give it much thought, as I was focused on Golden Tickets rather than the broader scope of Kerberos attacks. However, when re-examining Kerberos performance counters for this post, Mark’s 2018 blog came to mind and prompted me to revisit its ideas. This reminded me of the value in tracking and analyzing Kerberos traffic within a domain and how PerfMon counters could be useful in that regard. When properly analyzed, these counters provide rich metadata that can offer valuable context and significantly enhance detection capabilities.
First, What Is PerfMon?
PerfMon is a built-in Windows tool used to track system performance and gather detailed data on various aspects of system activity, such as CPU, memory, disk usage, and network traffic. In addition to system performance, PerfMon can also be used to monitor domain-related performance, including authentication processes and Active Directory activity, providing valuable insights into Kerberos-related events
Please note that my lab is a small Windows Active Directory (AD) domain, and of course, Your Mileage May Very (YMMV) 🙂!
Background
According to Microsoft, the Performance Monitor tool is:
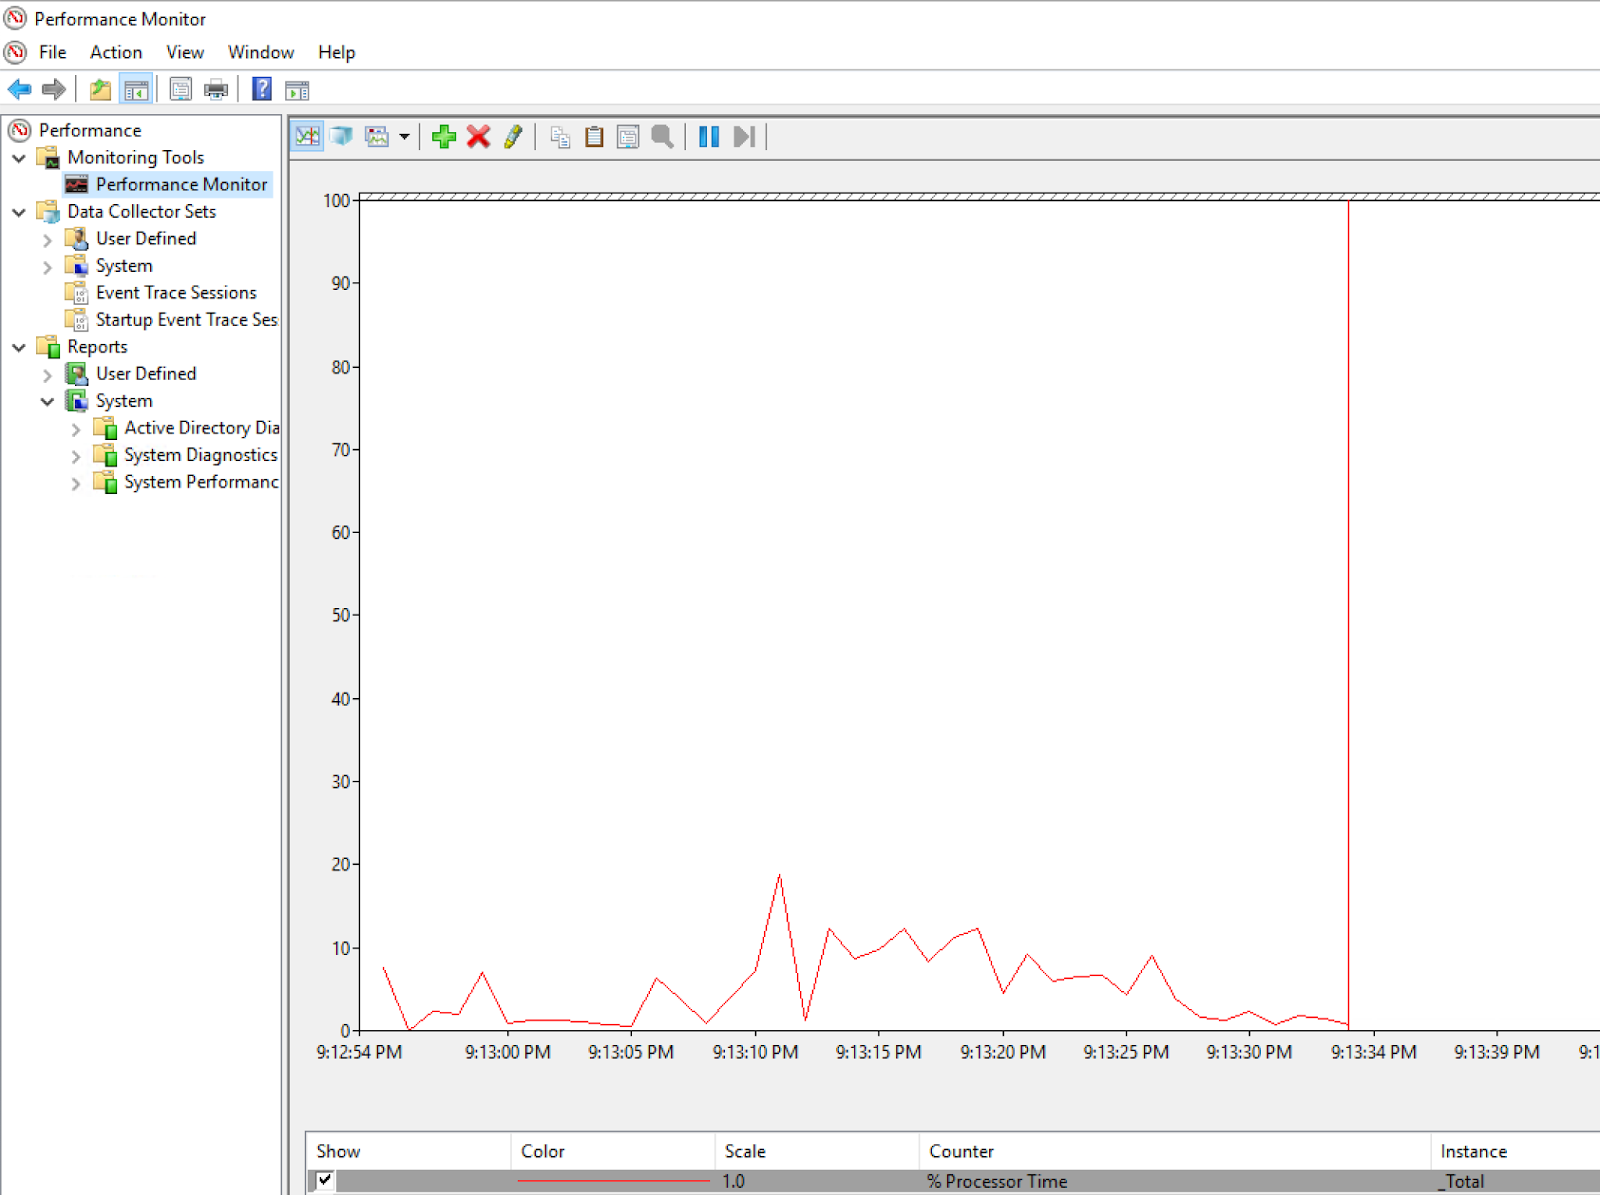
Primarily for viewing real-time statistics. By default only one counter is selected; the %Processor Time counter. However you can add additional counters by clicking on the green plus sign. This will allow you to monitor any counters you wish in real time.
After starting Performance Monitor (perfmon.exe) on a Domain Controller (DC), the following is evident, showing our DC’s process performance over time:
Logging
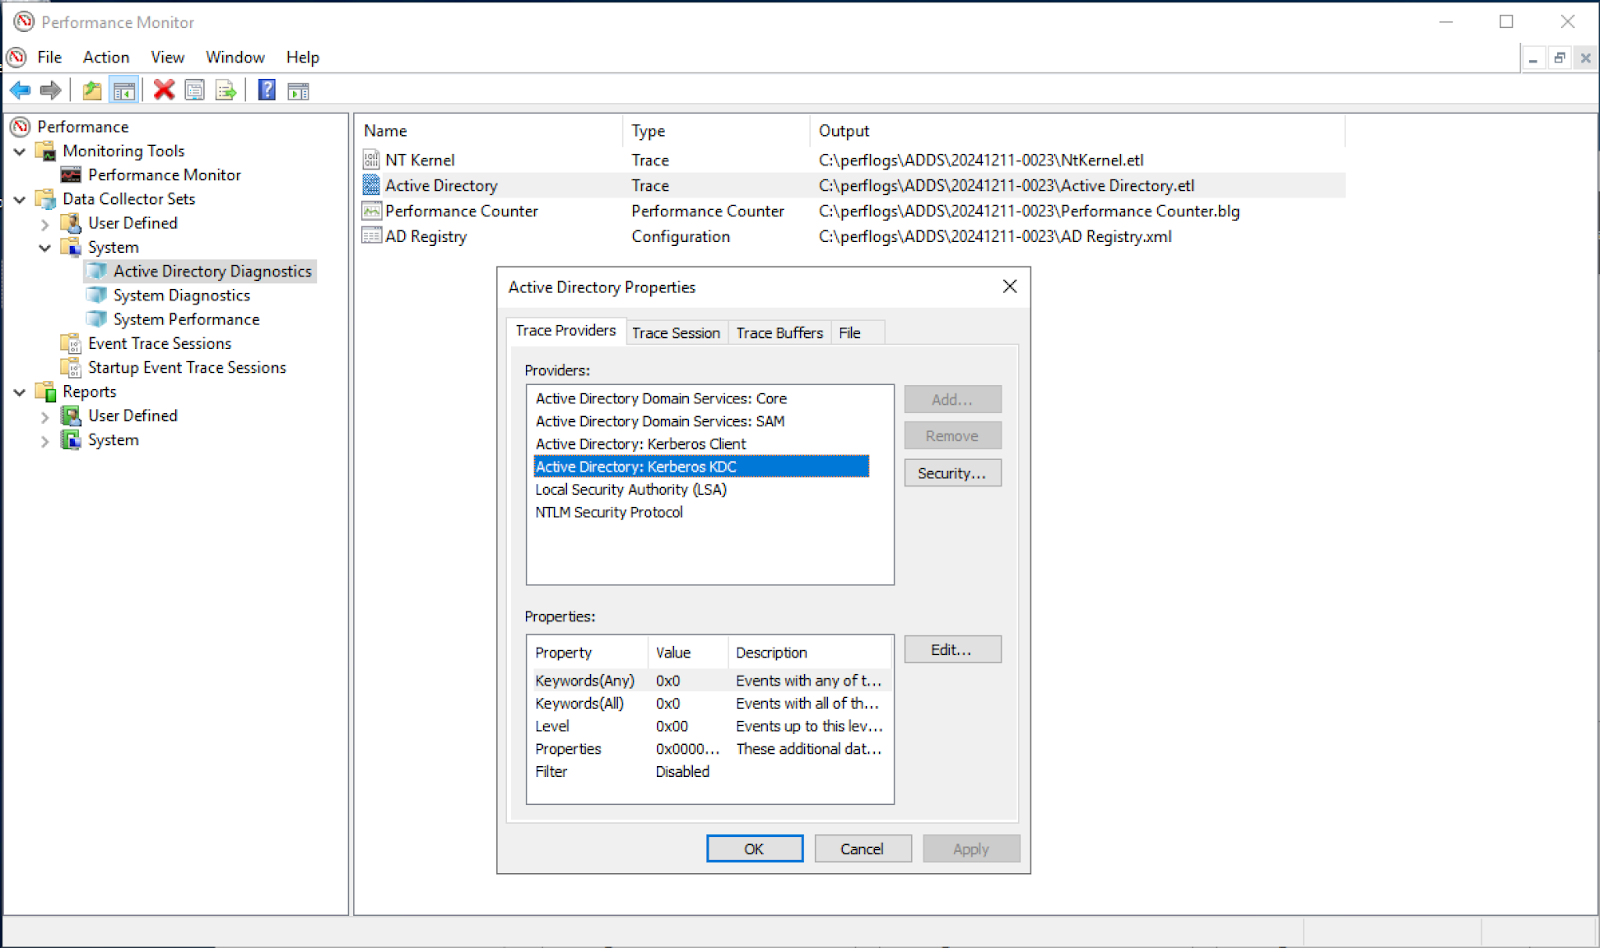
PerfMon can leverage Event Trace for Windows (ETW), an event mechanism, to provide insight into detailed actions. Luckily for us, it supports the ability to collect advanced information around Active Directory attacks. The Active Directory Diagnostics source, as shown in Figure 2, can consume events from the “Active Directory” event trace session. We'll explore how these logs can be useful for detecting Active Directory attacks such as Kerberoasting, AS-REP Roasting, and Roasting from the AS.
For a quick refresher on insights into how the attacks in the next two sections work, I highly recommend one of my favorite posts: "Kerberosity Killed the Domain: An Offensive Kerberos Overview" by Ryan Hausknecht. It does an excellent job of explaining the concepts and demonstrating both Kerberoasting and AS-REP Roasting.
Kerberoasting
Using the default Active Directory Diagnostics, Data Collector Set (System), we can start a trace prior to attack execution. Running a simple Kerberoast attack with Rubeus, with no “opsec” employed, the following results are returned:

Figure 3 immediately shows the action of mass TGS requests by a single account, which is one of the most common and simplistic ways to detect this attack. The evidence of this attack is further compounded by the LDAP query (with the infamous serviceprinicaplname=*) being logged:

We now have a clear indication of attack (IOA), with substantial context, of a client (i.e., source) and server relationship to help drive an effective response.
AS-REP Roasting
If we start another trace and alternatively conduct an AS-REP Roasting attack with Rubeus, we can get “similar” contextual results:


This also provides significant insight into the attack: the attacker touched our accounts, Thanos and Warmachine, which are configured not to require pre-authentication.
Roasting from the AS
While this attack shares similarities with Kerberoasting and AS-REP Roasting, it is distinct and perhaps not as widely recognized. This method was discovered by Charlie Clark, who wrote an excellent post detailing it here. Once we initiate our trace, the following events are also logged:

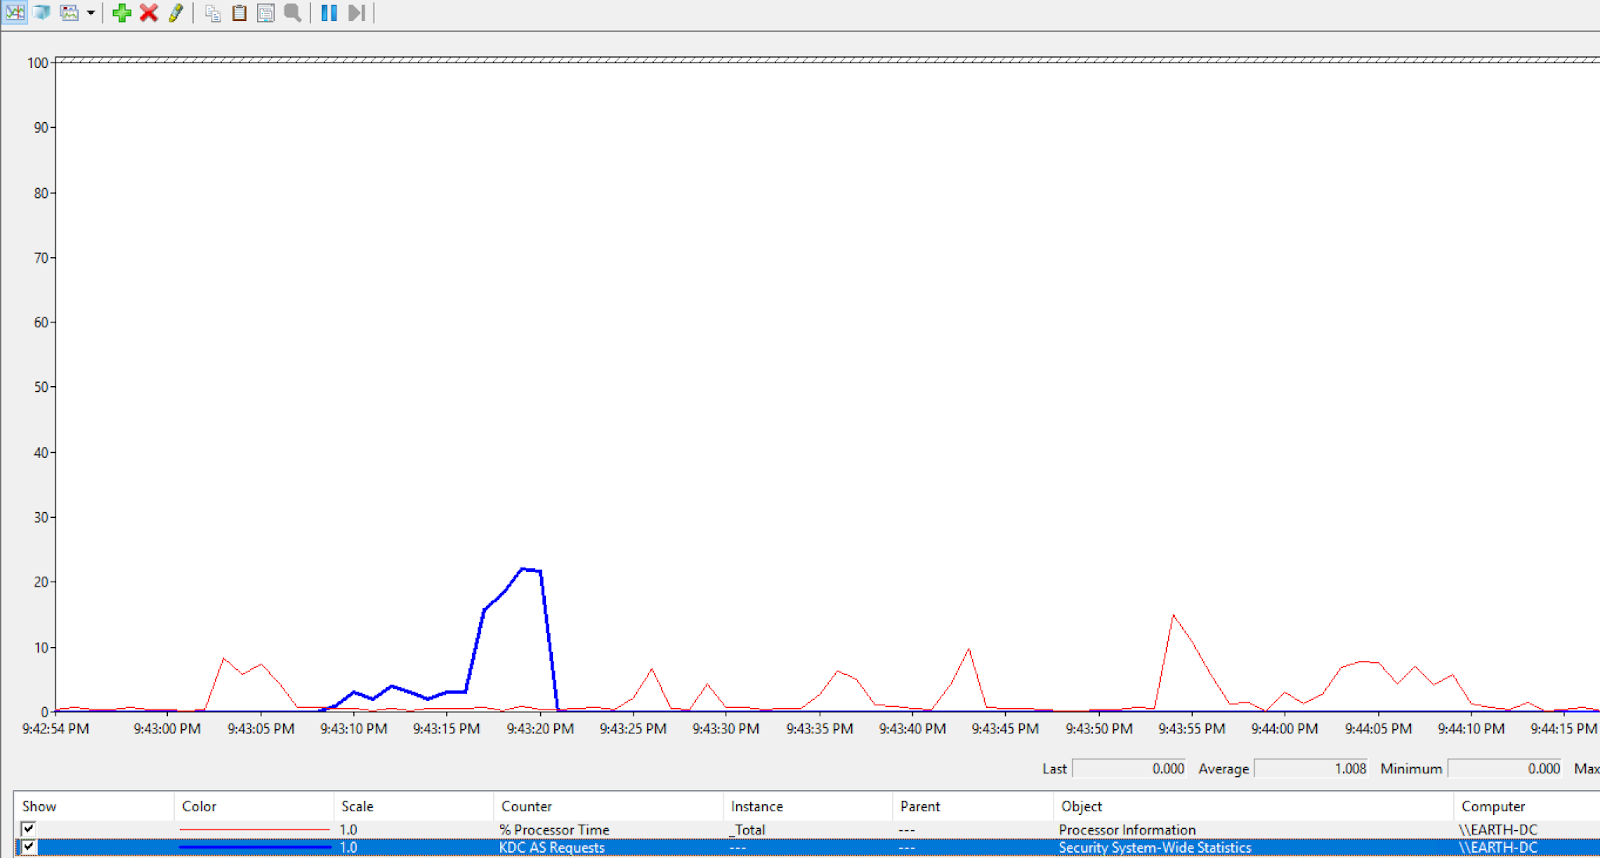
We have a strong indication that a mass request for AS Tickets was performed. Most interestingly, as a result of this attack’s execution, we can see a clear spike in our Kerberos AS Requests counter, as I was running this attack against all the users in my domain.
Conclusion
This post explored an alternative method for detecting Kerberos roasting attacks without solely depending on Windows Events 4768 or 4769. While this approach may not be ideal for scalable, real-time alerting and requires familiarity with attacker tradecraft, it opens up new avenues for detection by leveraging often-overlooked performance counters. These counters contain a wealth of metadata that, when properly analyzed, could add an additional layer of context to detection efforts.
It’s important to note that while PerfMon itself isn’t designed as a direct detection source, the underlying data it utilizes could be incredibly valuable if collected and analyzed by other sources. This approach may enable detection engineers to incorporate insights from system performance metrics into threat detection, thereby enriching the information available for uncovering suspicious patterns.
I am a strong advocate for thinking outside the box when it comes to detection engineering. If we can provide even a small bit of added context—like visualizing client/server relationships or unexpected behavior patterns—it enhances our overall visibility and strengthens our defensive posture. There’s always more to explore, and I believe creative approaches like this can push the boundaries of detection strategies in meaningful ways.
Bonus: Obfuscated LDAP
Obfuscation techniques via scripting interpreters or the command line are not new, but they may be gaining more traction with the release of MaLDAPtive. Charlie Clark’s -Obfuscate function in his fork of PowerView has been around since 2021. Using this function, we can send obfuscated LDAP queries to our Domain Controller and see the results in PerfMon:


In detection engineering, providing contextual information about obfuscation in LDAP queries is important in gaining enhanced visibility into Active Directory, one leg of the critical tripod that also includes Kerberos and NTLM. LDAP serves as the gateway for querying directory services, making it a prime target for adversaries seeking to enumerate users, groups, and permissions.
By capturing and analyzing contextual details—such as query patterns, obfuscation techniques, and associated metadata like source IPs or user accounts—we can illuminate gaps in visibility and identify malicious behavior attempting to blend in with normal operations.
Big thanks to Jonathan Johnson (@jsecurity101) for his valuable insights and explanations on how the underlying telemetry is captured and the internal mechanics work, which greatly enhanced this blog post.


