

At Huntress, we see a great deal of intrusions and share attack data with the community as we can. Today, we’ll highlight how Microsoft Defender and multiple services (namely Managed Microsoft Defender, Process Insights and Open Port Detection) enabled the Huntress team to identify threats in near real-time.
In our webinar How to Crush Cybercriminals with Managed Antivirus, we explored the technical highlights of an intrusion via a public-facing SQL server. Now we’d like to dive in and discuss some additional pieces of the incident and share some of what we learned.
To begin, let’s recount the attack sequence at a high level:
We often begin threat analysis as threaded conversations so we can keep the narrative of an attack in one place. This helps the team stay organized and creates a chronological record of how the investigation unfolds.

Then, we start collaborating together from the beginning and work together not only to investigate the incident but communicate between teams efficiently. Then, we get to work in the thread:

There’s a lot going on in this screenshot! Acronyms, internal code names and indicators of compromise! Let’s unpack this.
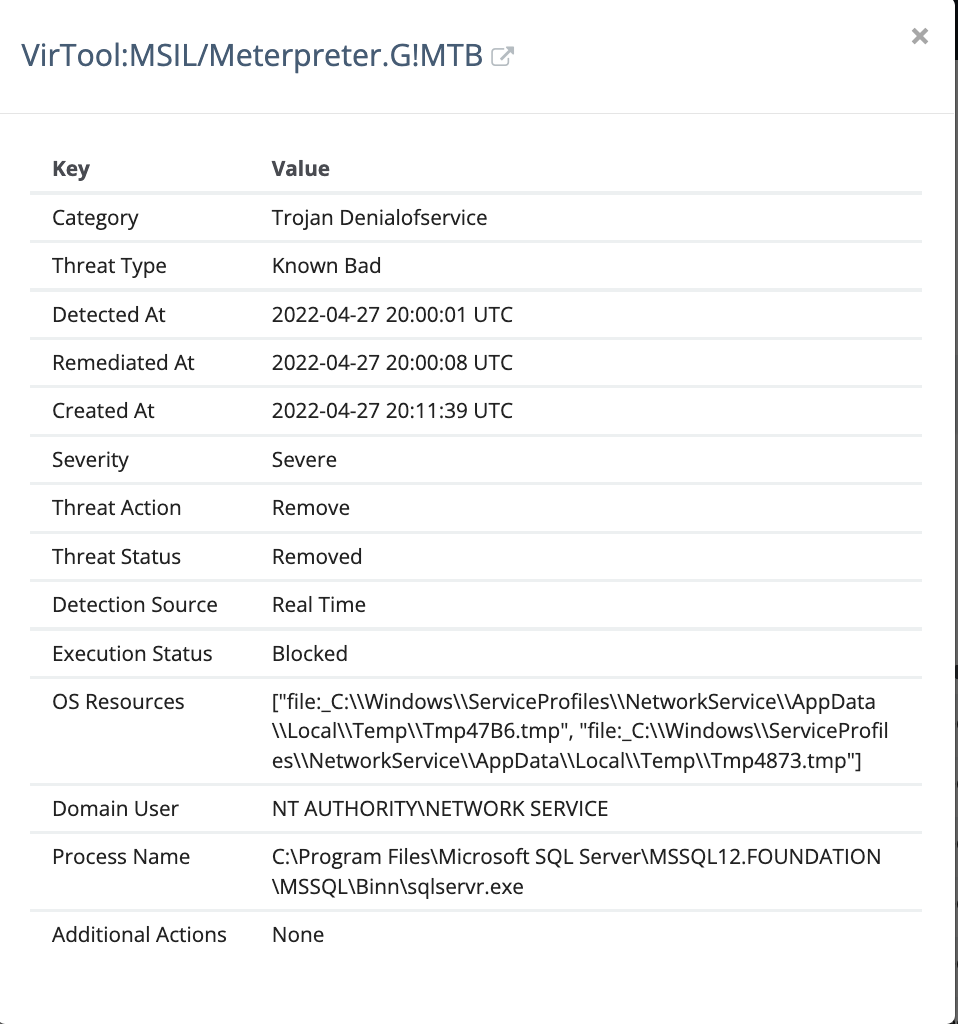
Microsoft Defender was our initial signal that a threat actor had access to the system. The Microsoft Defender alert identified Meterpreter: a hacking tool often used to create malicious callback stagers that allows threat actors interactive remote access to a system. A quick pivot from a Managed Antivirus alert to the Process Insights EDR data revealed the threat actor downloaded a .txt file containing a malicious script.
The information in the screenshot below helped us demystify this further, showing the original alert we received from our Microsoft Defender Managed Antivirus service.

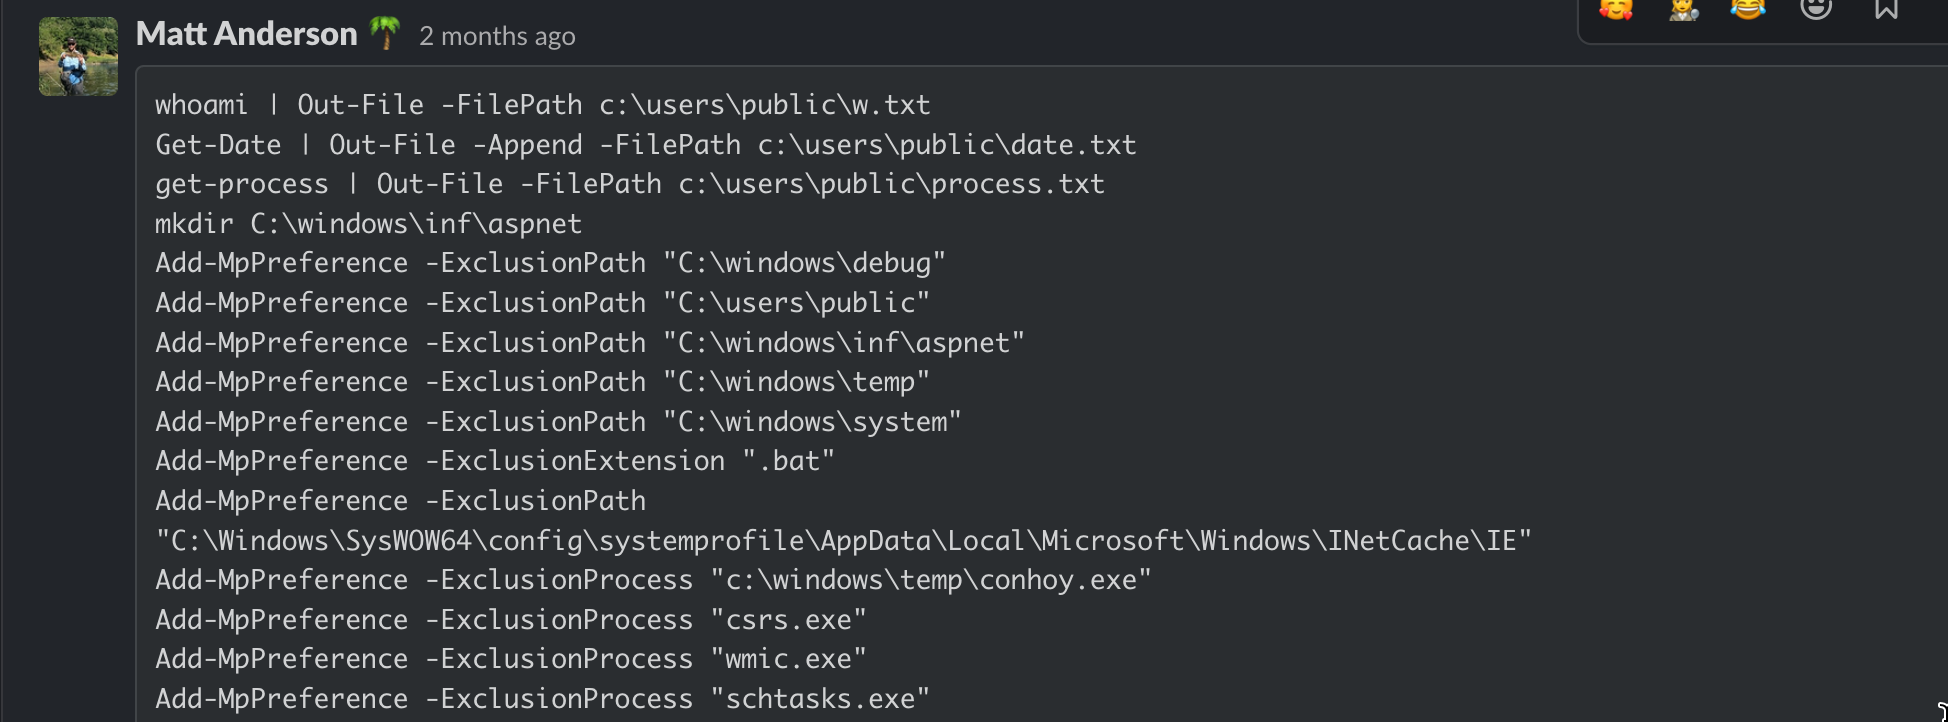
This alert triggered us to investigate further using our Process Insights EDR to dig into executing processes on the system:


The screenshot above lays out the contents of the malicious batch script downloaded by the threat actor. A large portion of the above commands perform defense evasion techniques by adding exclusions to Defender for various file paths, extensions and process names.
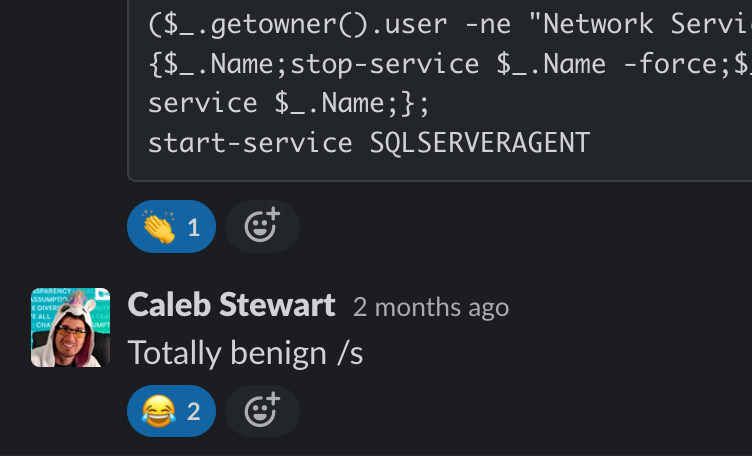
Our security research team had the following response to this script:

It’s pretty easy to see the malicious intent here, based on the number and location of the directories (many that are commonly used to store and execute malware from) and file extensions that were set to be excluded from Microsoft Defender to avoid being spotted and removed. They wanted no part of Defender meddling with their files.
This highlights the fact that threat actors often try to disable, blind or weaken the ability of any antivirus software to do its job, and demonstrates the importance of monitoring things like Exclusion paths and limiting the number of exclusions set to make it much harder on the threat actor to get away with this type of activity.
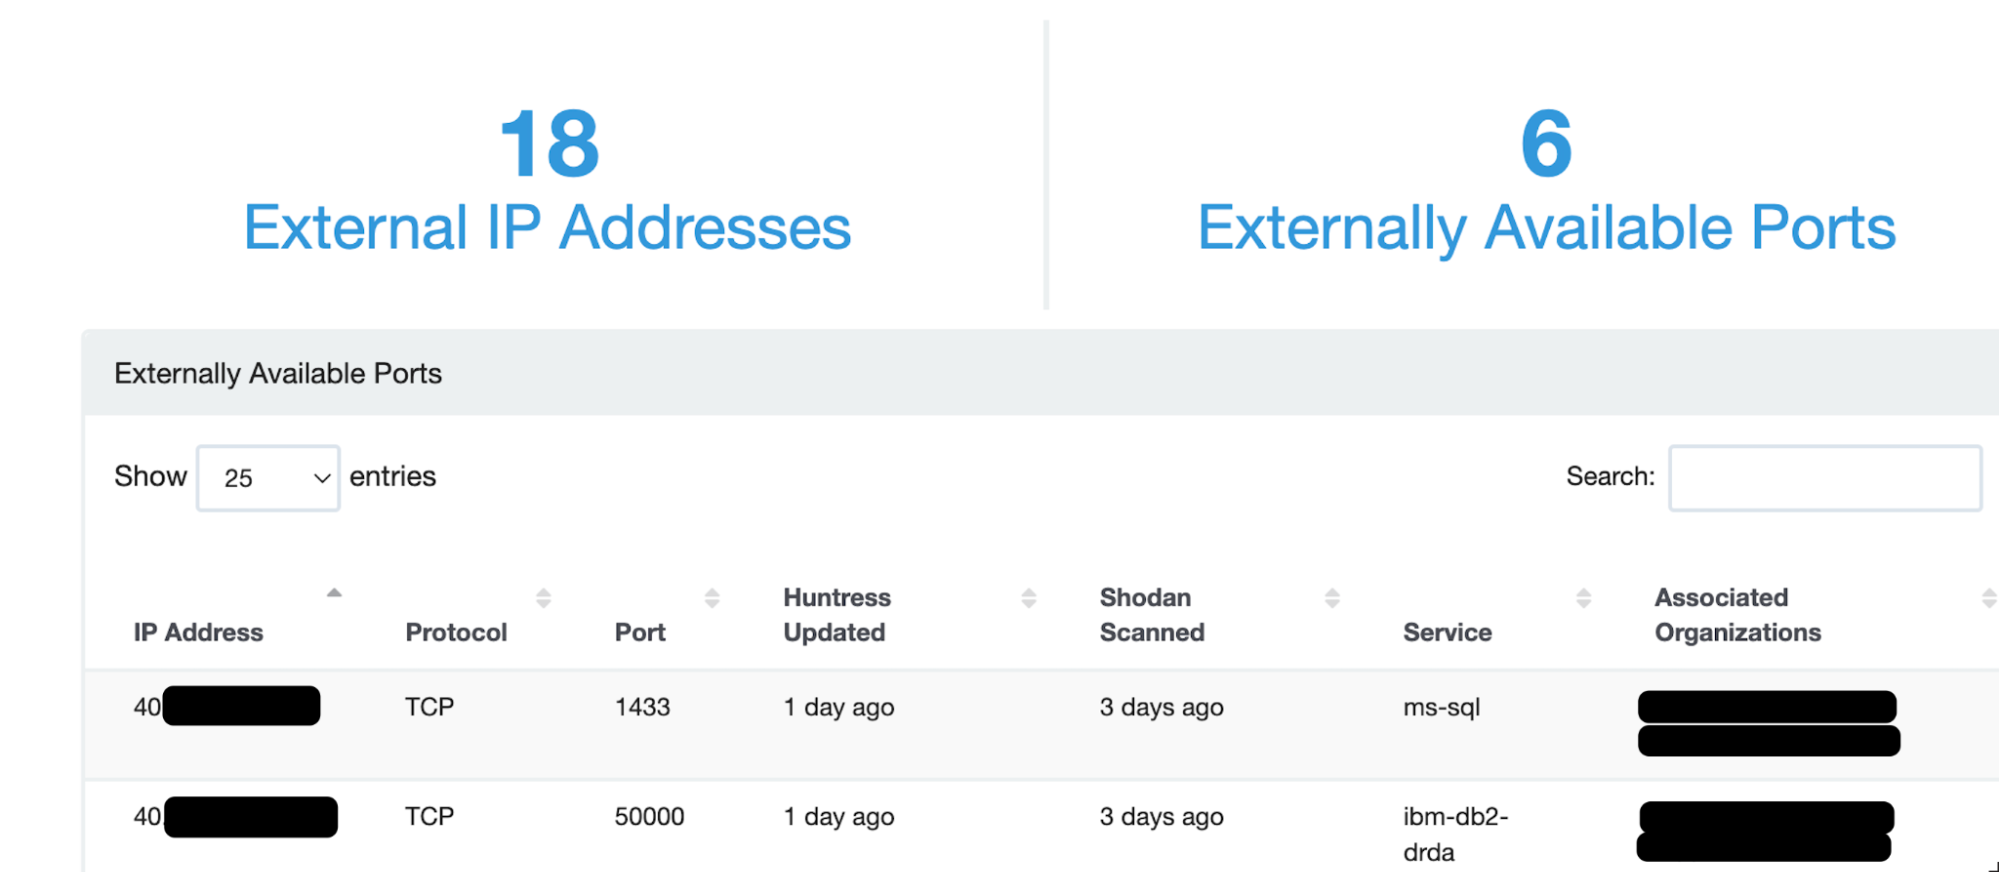
The team next discovered that port 1433 was open for public scanning via External Recon, our platform feature that offers visibility into internet-exposed services and devices that are present in an organization.

Whenever we detect an intrusion, External Recon is often where we look first to find a potential initial access vector. The easy way is often the actual way, so if a common port is exposed to the internet for all manners of scanning and probing for vulnerabilities or weak passwords for services protected by single-factor authentication, this presents a strong possibility for how the threat actor entered the network.
Once we understand how a threat actor gained initial access, we’re able to forecast other potential pieces of the puzzle—something we recently discussed during a Tradecraft Tuesday episode—and direct our attention to specific forensic artifacts that are likely to tell the next part of the story.
In this case, the SQL server logs were of interest if this server did actually provide the initial access vector to the network. When we looked at the logs, they appeared to tell the story that we expected, of brute forcing (repeated failed logins from IP addresses in foreign countries) the authentication method to gain entry into the server. With the evidence found here to confirm our initial suspicions of access via the internet-exposed SQL server (port 1433), we can move on to the next piece to further clarify the full picture of this intrusion.

Thanks to Microsoft Defender detecting and alerting us to this activity, we were able to assemble the team to investigate it further. Quickly pivoting to additional telemetry from the Process Insights EDR, External Recon, a little open-source intelligence, a few forensic artifacts and some malware analysis, we were able to round out the investigation.
We determined that it was malicious, and promptly provided the necessary remediation actions on the report sent to the partner to squash this activity and evict this threat actor before the incident escalated any further.
Now that we’ve fully explored the active investigation component, we can start moving toward post-mortem actions. We always want to use any incident that occurs as a learning opportunity for us, our partners and the community whenever we can, and this incident provided opportunities for all three.
Our Security Engineering team is critical as the technical interface for many partners. They, along with our Partner Success and Product Support teams, do a great job of translating analyst findings and reports into actionable, conversational pieces with partners.

Our Product Support team is also always quick to jump in and start the conversation with a partner when needed, as well as relaying critical information back to analysts if the partner has more questions and more information to provide to us to aid in our analysis.
In this instance, like many others, one of our security engineers gains a better understanding of the organization’s security posture (internet-exposed ports, insecure server authentication methods, lack of monitoring authentication and other server logs, possible Antivirus misconfigurations, etc.) that may have led to the incident, and can offer additional recommendations to increase their overall security posture and minimize the impact of or even prevent a future incident.
We often learn from incidents ourselves as we see new attacks for the first time. Director of ThreatOps Max Rogers regularly says that attackers don’t like to change their behaviors. Instead, they prefer to drop their malware in the same directories during their intrusions (often with similar file names and identical processes/impact) or even use playbooks with the exact same procedures each time they carry out an attack
This means that writing down ideas for detections and collaborating with our Detection Engineering team is a critical part of the feedback loop from any investigation or incident. Any time we see a new behavior, we immediately begin looking for ways to detect it in the future. Then our Detection Engineers can create a new Detector to make our response even faster the next time, as well as continually test the efficacy and reliability of our automated alerting.

At this point, we’re ready to share our findings to help the community as a whole learn as much as we did during an investigation.
We rely on our Marketing team to help us with that task:

We love sharing interesting cases and content, but even more than that we love sharing useful information that can directly benefit the community, making life easier for SMBs and those that help secure them. This incident provides a good opportunity to do just that—as this was specific behavior that, if detected, is very likely to be malicious.
Other recent articles, such as one by the DFIR Report, note an increase of attacks against SQL servers recently, so monitoring login attempts of public-facing servers as well as the behavior occurring on these servers is critical. Collecting telemetry from servers and endpoints in your network is just the first step, however, and having a method for analyzing the telemetry is just as important.
One way to do this is by using Sigma rules to look for signs of malicious behavior. Sigma is a generic format for writing signatures to analyze various log files, like Windows Event Logs, for example, which can be used across a wide variety of platforms and tools.
This Sigma rule will detect the malicious behavior that occurred in this incident:
It's very specific to the threat we saw and should result in very few false positives, but because it is very specific, you may need additional rules to catch other malicious activity using the SQLPS module or other similar SQL modules that can be misused for evil.
If you take away anything from this blog (other than the above Sigma rule, of course), I hope it’s this:
At Huntress, we will viciously tear apart every intrusion, leveraging every source of telemetry we can get our hands on. We will pivot from data source to data source—whether that’s Managed Antivirus alerts, or Process Insights EDR data, or the forensics artifacts on a machine—and we’ll leverage as many contextual parameters as we can, like External Recon, to provide threads of evidence that allow us to weave together a cohesive account of the adversarial campaign and report it back to our partner with actionable recommendations.
In this case, Managed Microsoft Defender (previously known as Managed Antivirus) tipped us off and piqued our curiosity, but it took a combination of Process Insights, Open Port Detection, and malicious tooling left on the host to truly illuminate this attack.
Get insider access to Huntress tradecraft, killer events, and the freshest blog updates.
